Celebration Marathon 2018
I always enjoy reading race analysis posts like this one The Runners of the Boston Marathon 2017 and this one Eliud Kipchoge 2:00:25.
As a recreational runner, I find it entertaining to to learn about how other, more competitive, runners do.
So Barry Smyth, thank you for the inspiration.
Most of these analyses, however, usually cover the big races. Here, I take a stab at a small race. Specifically, the last race I’ve run. I present to you the Celebration Marathon 2018 Race Analysis.
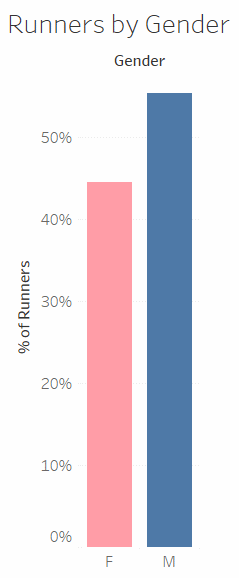
Lets start easy with a runner breakdown by gender for the 2018 Celebration Marathon. We can see that there are quite a few more men running than there are women. I wonder if this is the norm for marathons. Note to self; crosscheck this in future race analyses.
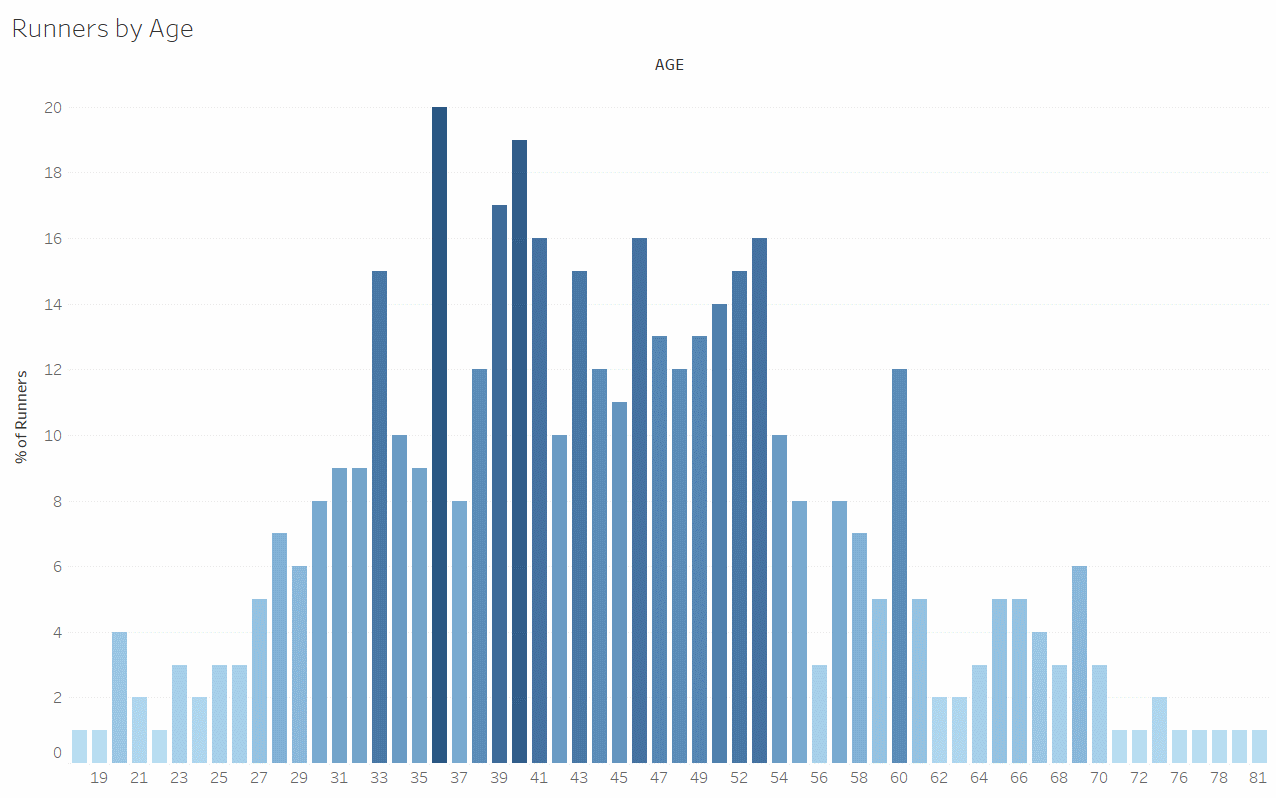
Next up, let’s look at the runner breakdown by age. Such a big age spread is not that unusual in running. With the youngest runner aged 11 and the oldest 81, running truly is the sport for all ages.
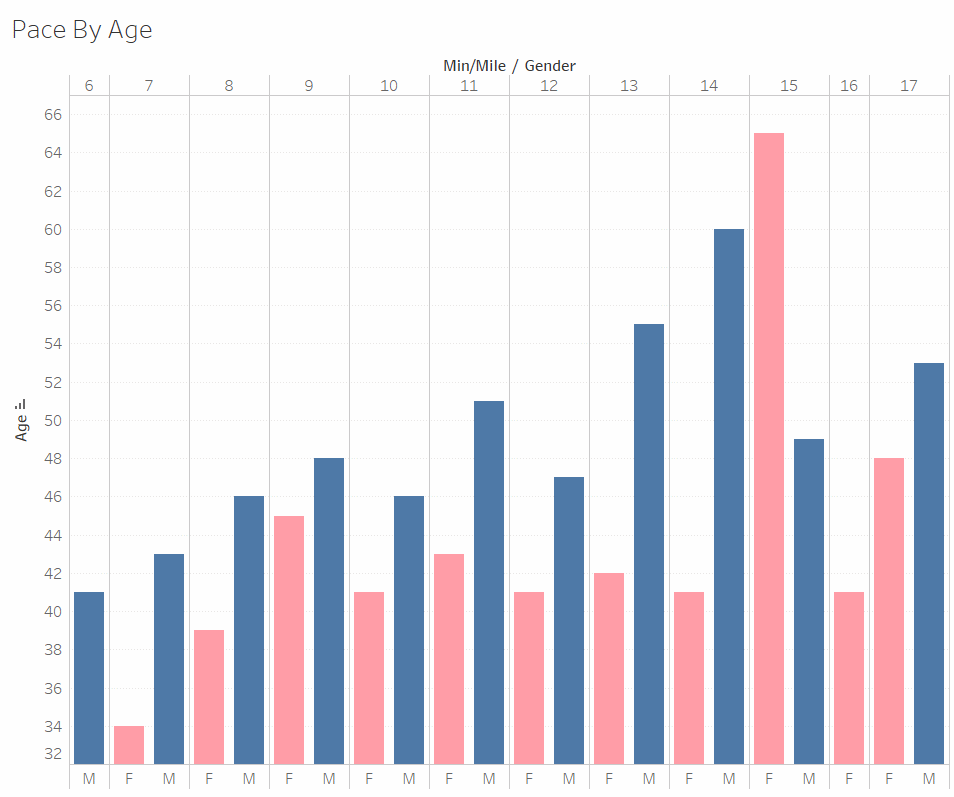
Although training and ‘things lining up’ on race day have a big influence on pace, these are very hard to quantify. Most likely, what we see here is how external factors affect running paces (by age). Factors like elevation, humidity and heat play a big part on running in general. Go ahead; lookup your pace (or age) and see if it matches up.
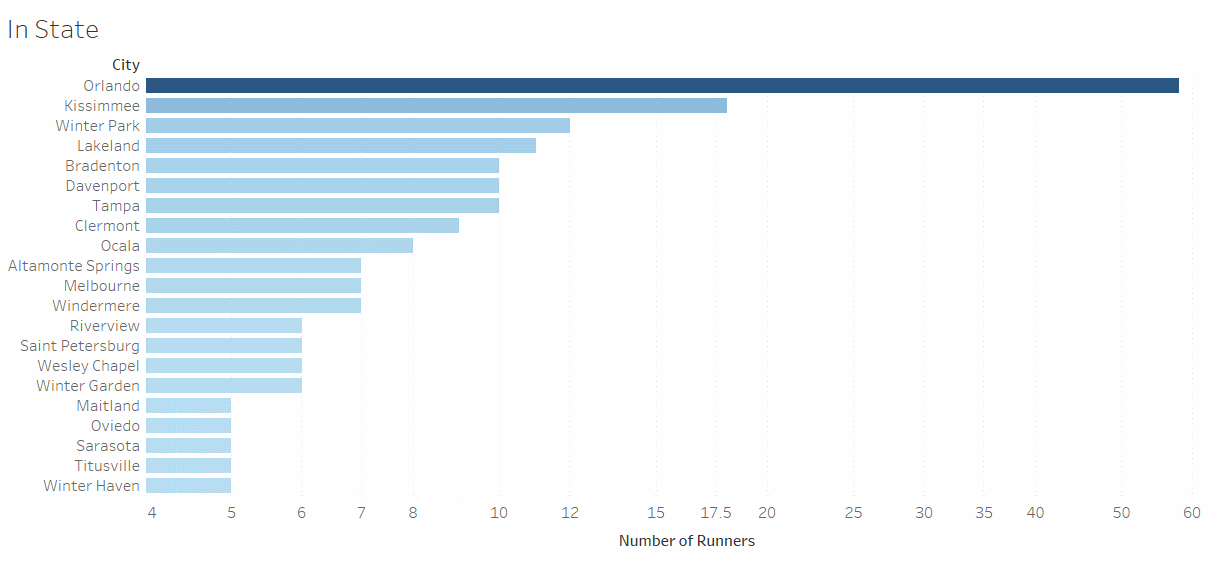
Here, we can easily see that this a local race.
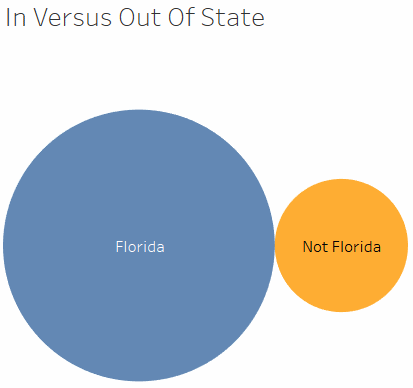
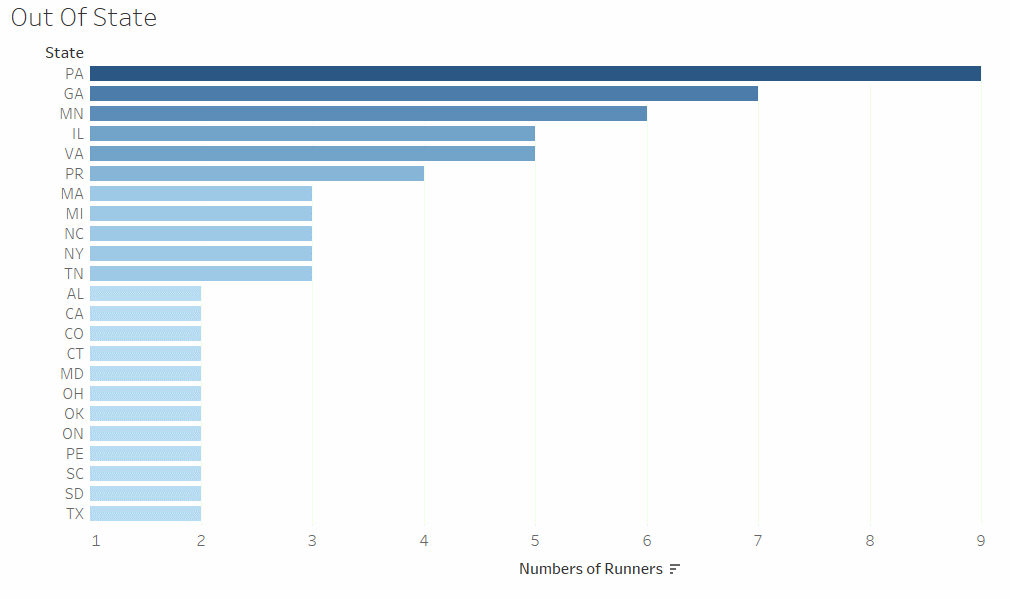
Further diving into the runner’s residences, we can see how out of state runners break down by state.
Next, we see how in local runners break down into cities in Florida.
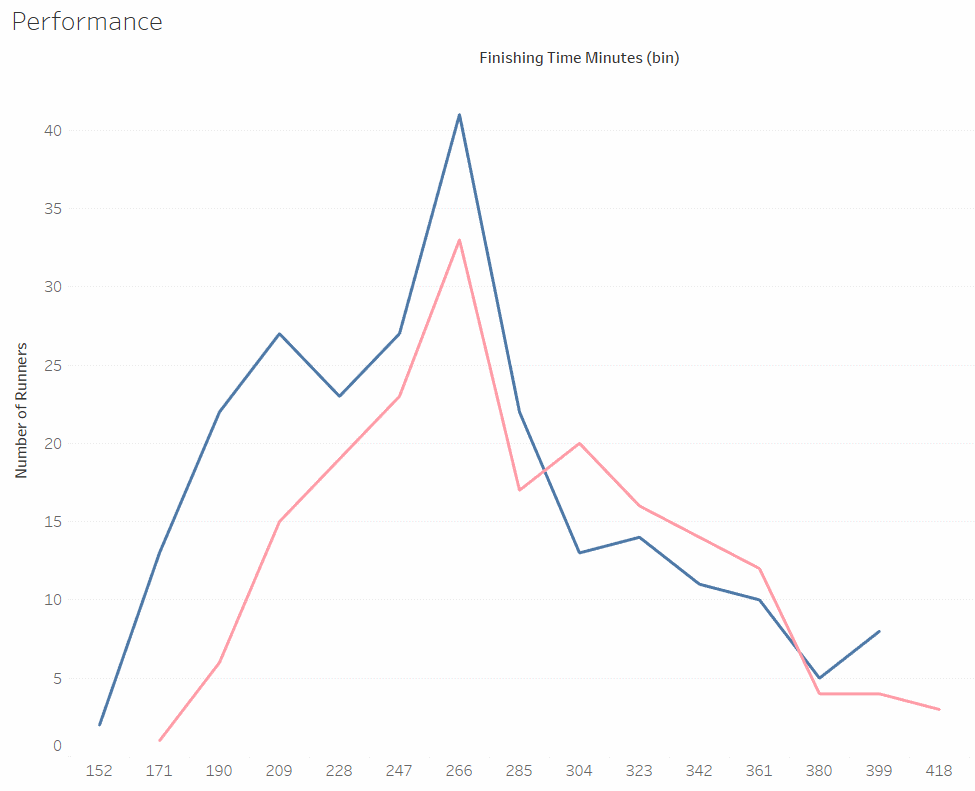
Next up, we have the number of runners broken down by finishing times (in minutes). Generally, a larger number of men than women finish the race in 300 minutes or less. In contrast, a higher number of women runners finish the race in more than 300 minutes.
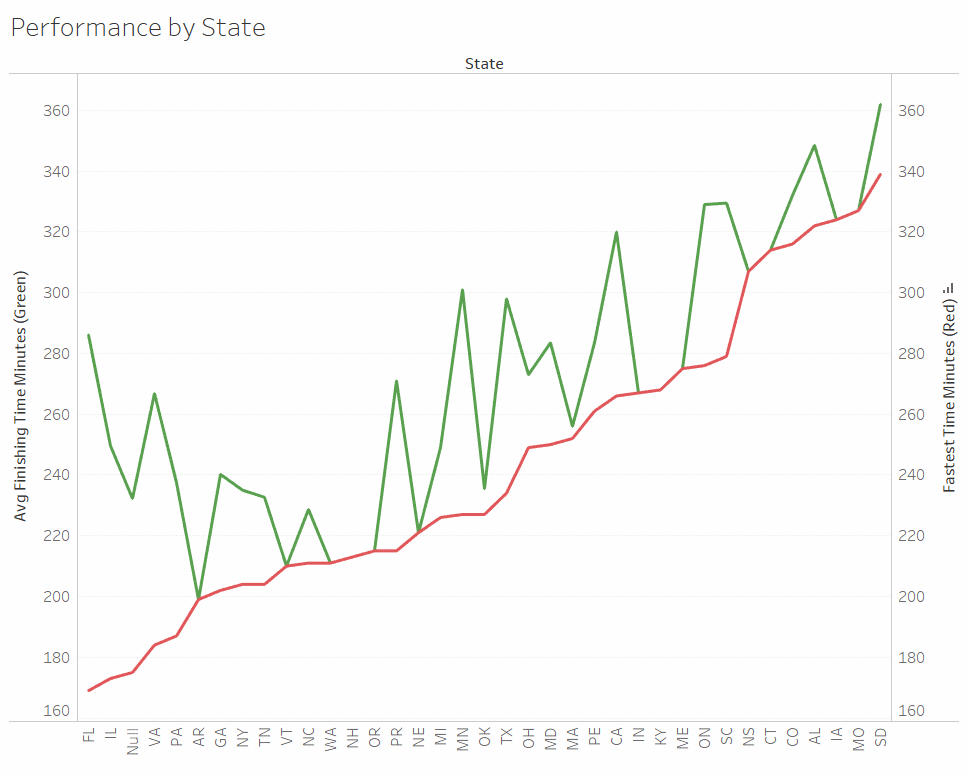
Here we see how runners performed grouped by state. Notice the gap between the fastest runner for each state and the state average. When you see lines that touch, that means that there is only one or two runners from that state.
Finally, we collect a few more interesting facts that do not merit a chart for themselves.
| Attribute | Value |
|---|---|
| Date | Jan 28th, 2018 |
| Runners | 458 |
| Finishers | 429 |
| Dnf | 29 |
| Youngest | 11 |
| Oldest | 81 |
| Total mens | 254 |
| Total women | 204 |
| Fastest pace / time | 6:27 / 2:48:57 |
| Slowest pace / time | 17:45 / 7:44:49 |
| Average pace / duration | 10:45 / 4:41 |
| Lowest temperature | 63 |
| Highest temperature | 81 |
- Paces are in minute/miles and times are in hour:minutes:seconds.
And with that, we conclude our look at the 2018 Celebration Marathon. Thank you for reading.
The data used for this post resides in this repo.